Data Analysis Assignment Help Sample on Real Estate in Canada
- 27 November 2024
- Posted by: OAH
- Categories: Business & Management, Maths and Statistics

This is a Data Analysis Assignment Help Sample focused on real estate trends in Canada. The study analyzes housing prices across major Canadian cities from 2018 to 2020, using statistical tools like control charts, average sales price (ASP), and standard deviation. It highlights the impact of mortgage rates on market stability and provides insights for investors and students in mathematics and business. This assignment is also crucial for Statistics and Data Analytics students to understand how we approach Data Analysis Assignment Help.
Contact us today if you are also looking for Data Analysis Assignment Help!
Assignment Question:
Using statistical tools such as control charts, average sales price (ASP), and standard deviation, analyze real estate trends across major Canadian cities from 2018 to 2020. Evaluate the impact of mortgage rates on housing market stability and provide recommendations for investors and policymakers to optimize investment strategies and market conditions.
Table of Contents
Data Analysis Assignment Help Example
Canadian Real Estate Trends: Statistical Analysis Using Control Charts
Introduction
We have been provided with the real estate data of 5 cities in Canada and British Columbia. The houses have distinct sale prices in different cities. Moreover, they have varied sale prices in the same cities in different months from Jan 2018 to Jan 2020. Thus, it was difficult for an investor and a house hunter to calculate the best possible location to move basis their requirements and cost appetite. We try to eliminate the problem through our detailed analysis by comparing the differences and similarities between the cities.
Section 1
The Extent of Problem and Example from the Data
(Wikipedia, 2022) “From 2003 to 2018, Canada saw an increase in home and property prices of up to 337% in some cities. By 2018, home-owning costs were above 1990 levels when Canada saw its last housing bubble burst. In April 2019, the Bank of Canada released a report entitled “Disentangling the Factors Driving Housing Resales” in which they stated Canada’s housing market is “currently in uncharted territory.” It states the rapid increase in pricing in certain markets can be attributed to an unexpectedly robust labor market and fear on the part of buyers of being priced out of the market. The report states, “Much of the previous strength in resale activity was influenced by extrapolative expectations.”
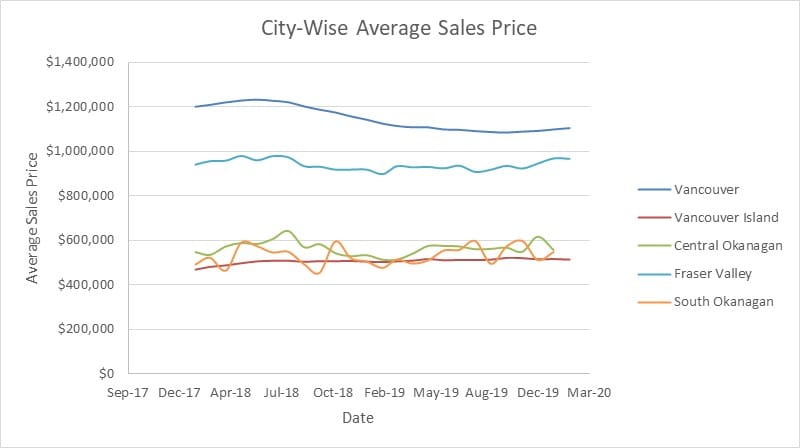
The result of the above problem is shown in the graph below where average sales of the houses took a hit in most of the cities during late 2018 and early 2019.

Section 2
Body

As can be seen from the graph, Vancouver City has the highest average sales price of all of the residential areas given. Followed by Fraser Valley. However, it can be argued that we have been given the Median sales price for Fraser Valley and not the average and we know that the median is always greater than the mean. Thus we can expect a lower average price for Fraser Valley.

As can be seen from the graph, Vancouver City’s single-type residential area has the highest average sales price of all of the residential areas given. It can be inferred that,
- Single homes in Vancouver City have the highest Average Sales Price
- All Single homes sold in Vancouver are priced above 1 million dollars
- We are given the benchmark price for Vancouver Island residences; the actual average sales price may be higher or lower
- We are given the median sales price for Fraser Valley; the Average sales price would be less than the one we are seeing in the graph
- South Okanagan residences have almost the same sales price pattern, but the average price is greater for single homes
- Fraser Valley Apartment and Vancouver Valley Apartment have almost constant Average Sales prices throughout the term
(Boykin R., 2022) “In a dynamic free market, lenders—whether government-backed or privatized—compete for home buyers’ business, which drives up or down average monthly interest rates on mortgage loans.” We see a big impaconof mortgage rates in the results from our data.

We infer from the above graph that; Prices were soaring during mid-2018 and were reduced during 2019 but again gained some momentum at the end of 2019. The fall in prices in 2019 was because of increasing mortgage lending rates which affected the home buyer’s purchasing power. The average sales price has a deformity during September 2019 due to significant falls in housing starts.
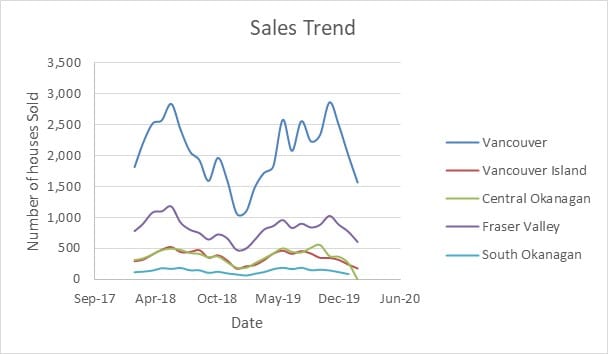
Due to economic factors, and weak local real Real-Estate queues, the sales trend took a rather unusual trendline,

The cause of this unique trend line is two-fold:
- The Sales of the houses hit the lower circuits during late 2018 and early 2019 due to the same macroeconomic factor of increasing mortgage rates.
- The Sales of houses were highly volatile in Vancouver simply because of the high average price in the city with house buyers being less interested in buying an expensive house with an increased interest rate.
Now that we have discussed the causes of overall effects on the house prices in different cities, let us turn our discussion towards comparing the cities with one another.
Though many approaches were possible for comparison, we have turned towards averages and Statistical Control charts in the given report.

The above image provides the city-wise Average Sales price and standard deviation of the sales price. Points to note are:
- Vancouver has the highest Average sales price (ASP).
- Fraser Valley sits next on the list, but the houses sold in comparison to Vancouver is very less.
- Central Okanagan, South Okanagan, and Vancouver Island have almost thesame ASP but the point to note is that the Standard deviation for Central Okanagan and South Okanagan is quite high as compared to the other cities. This causes uncertainty in the market and that is why their average sales are less than others.
- The data also suggests that mid-2018 was the best period of sales for most of the cities as three out of five cities had hthe ighest ASP in that phase. This can be attributed to just before the housing bubble burst in the market.

The above image provides the Residence-wise Average Sales price and standard deviation of the sales price.
The key points to note are:
- Vancouver’s Single-type apartment has the highest ASP across different types of residences.
- No significant standard deviation is observed in any residence type
- Again, The data also suggests that mid-2018 was the best period of sales for most of the cities as five out of nine residence types have the highest ASP in that phase
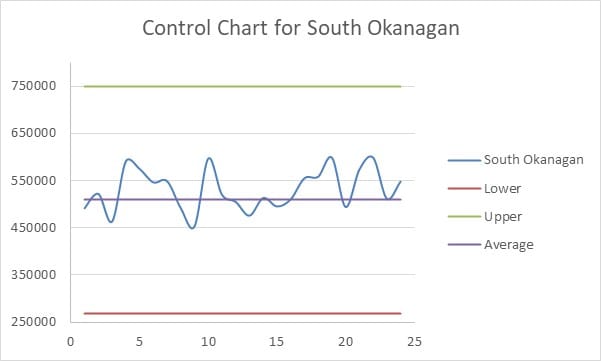
(Asq, n.d.) “The control chart is a graph used to study how a process changes over time. Data are plotted in time order.”
Looking at the control charts:

The control chart is within the control limits yet is not stable as it does not follow the rule of seven. Yet the chart seems symmetric. The data line passes just once through the average line.

The chart is within the control limits but not stable as the rule of seven is not followed, also the chart is not symmetric. The data line starts well below the average, hovers over it for some time but then gradually goes above the average. Though we can see it converging back towards the average in the future

The chart is within the control limits but not stable as the rule of seven is not followed, also the chart is not symmetric. The data line keeps near the average but often goes well wide of the average during the course.

The chart is within the control limits but not stable as the rule of seven is not followed, also the chart is not symmetric. The data line keeps near the average line but often keeps below it.

The chart is within the control limits and is also stable as the rule of seven is followed, but the chart is not symmetric. The data line often passes through the average line.
Thus we can see that though all the cities saw the impact of the bubble burst each city responded uniquely and in comparison, some fared better while some were left reeling in the losses.
Conclusion
(Roosevelt, F.D., n.d.) “Real estate cannot be lost or stolen, nor can it be carried away. Purchased with common sense, paid for in full, and managed with reasonable care, it is about the safest investment in the world.”
The data was given for some of the cities of Canada and British Columbia where data regarding the sale of the houses specific to each city was provided. This phase constituted both, going in and coming out of the real estate bubble in Canada and how different cities coped with it all. Through analysis, we found that Vancouver had the most expensive sale price with the average being above $1.2 million. We saw that house sale price was suddenly reduced in late 2018 and early 2019 when the mortgage rate in Canada was increased to around 4.5%. This was coped up by reducing the mortgage rate to around 4.08% later on. But during the period of high mortgages, the real estate market suffered,d and business was reduced in all cities with Vancouver taking the biggest hit.
We recommend slowly and steadily increasing the mortgage rates rather than in great numbers. The effect of Inflation, Unemployment, and Exchange rates was not seen that much as they almost remained constant throughout the term. The Building permits in both British Columbia and Canada had a minor effect on the sale of the houses but not enough to be noticeable in the long run.
Recommendation
- The house owner’s association and Real Estate firms can ask the banks to not increase mortgage rates by ha igh margin.s
- The government can develop cities so that most of the home buyers are not attracted to Vancouver even with its high prices.
- The prices of houses must be hedged by purchasing in two different locations so that we are not exposed to extreme losses and profits.
- Laws must be made against the sudden increase in mortgage rates.
- Strict laws to avoid real estate bubbles.
References
ASQ (n.d.). Control Chart.: https://asq.org/quality-resources/control-chart
Boykin, R. (2022, Apr 13). Explaining Rising Interest Rates and Real Estate to Clients: Investopedia
Roosevelt, FD (n.d.). 30 INSPIRING REAL ESTATE QUOTES THAT WILL CHANGE YOUR LIFE: Real Wealth
Wikipedia (2022, Apr 30). Canadian Property Bubble
Appendix
ASP
Average Selling Price
Rule of Seven
On a control chart, when seven consecutive data points fall on the same side of the mean, either above or below, the process is said to be out of control and in need of adjustment. All seven points may be within the control limits. Such a situation is not considered normal (or common) and warrants an investigation.
Check other Samples:
- Corporate Social Responsibility at Tesco in UK
- SWOT and PESTLE Analysis of TESLA Company
- US TikTok Ban: Analyzing Public Discourse and Global Implications


